scipy.special.ndtr#
- scipy.special.ndtr(x, out=None) = <ufunc 'ndtr'>#
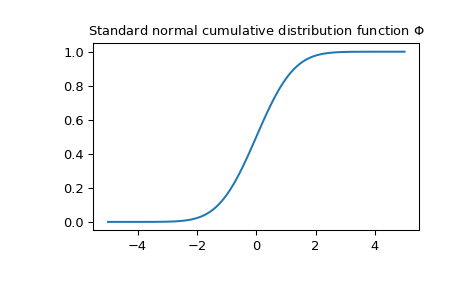
Cumulative distribution of the standard normal distribution.
Returns the area under the standard Gaussian probability density function, integrated from minus infinity to x
\[\frac{1}{\sqrt{2\pi}} \int_{-\infty}^x \exp(-t^2/2) dt\]- Parameters:
- xarray_like, real or complex
Argument
- outndarray, optional
Optional output array for the function results
- Returns:
- scalar or ndarray
The value of the normal CDF evaluated at x
See also
log_ndtrLogarithm of ndtr
ndtriInverse of ndtr, standard normal percentile function
erfError function
erfc1 - erf
scipy.stats.normNormal distribution
Notes
Array API Standard Support
ndtrhas support for Python Array API Standard compatible backends in addition to NumPy. The following combinations of backend and device (or other capability) are supported.Library
CPU
GPU
NumPy
✅
n/a
CuPy
n/a
✅
PyTorch
✅
✅
JAX
✅
✅
Dask
✅
n/a
In addition,
ndtraccepts MPArrays; calculations will be performed with the precision set bympmath.mp.dps. For the NumPy backend, this function supports all NumPy ufunc keyword arguments. Other backends may supportout, but typically none of the other ufunc kwargs.outis typically supported for CuPy and PyTorch, but not currently in cases where SciPy relies on a generic Array API implementation or, for PyTorch on CPU, falls back to the NumPy backend.outis never supported for JAX because JAX arrays are immutable.See Support for the array API standard for more information.
Examples
Evaluate
ndtrat one point.>>> import numpy as np >>> from scipy.special import ndtr >>> ndtr(0.5) 0.6914624612740131
Evaluate the function at several points by providing a NumPy array or list for x.
>>> ndtr([0, 0.5, 2])
array([0.5       , 0.69146246, 0.97724987])
Plot the function.
>>> import matplotlib.pyplot as plt
>>> x = np.linspace(-5, 5, 100)
>>> fig, ax = plt.subplots()
>>> ax.plot(x, ndtr(x))
>>> ax.set_title(r"Standard normal cumulative distribution function $\Phi$")
>>> plt.show()