flattop#
- scipy.signal.windows.flattop(M, sym=True, *, xp=None, device=None)[source]#
Return a flat top window.
- Parameters:
- Mint
Number of points in the output window. If zero, an empty array is returned. An exception is thrown when it is negative.
- symbool, optional
When True (default), generates a symmetric window, for use in filter design. When False, generates a periodic window, for use in spectral analysis.
- xparray_namespace, optional
Optional array namespace. Should be compatible with the array API standard, or supported by array-api-compat. Default:
numpy- deviceany
optional device specification for output. Should match one of the supported device specification in
xp.
- Returns:
- wndarray
The window, with the maximum value normalized to 1 (though the value 1 does not appear if M is even and sym is True).
Notes
Flat top windows are used for taking accurate measurements of signal amplitude in the frequency domain, with minimal scalloping error from the center of a frequency bin to its edges, compared to others. This is a 5th-order cosine window, with the 5 terms optimized to make the main lobe maximally flat. [1]
Array API Standard Support
flattophas support for Python Array API Standard compatible backends in addition to NumPy. The following combinations of backend and device (or other capability) are supported.Library
CPU
GPU
NumPy
✅
n/a
CuPy
n/a
✅
PyTorch
✅
✅
JAX
✅
✅
Dask
✅
n/a
See Support for the array API standard for more information.
References
[1]D’Antona, Gabriele, and A. Ferrero, “Digital Signal Processing for Measurement Systems”, Springer Media, 2006, p. 70 DOI:10.1007/0-387-28666-7.
Examples
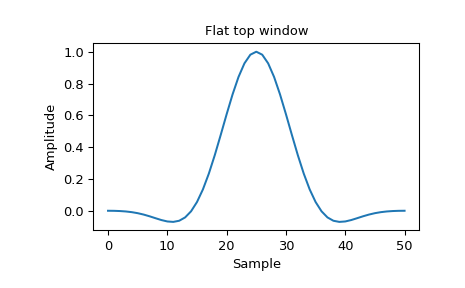
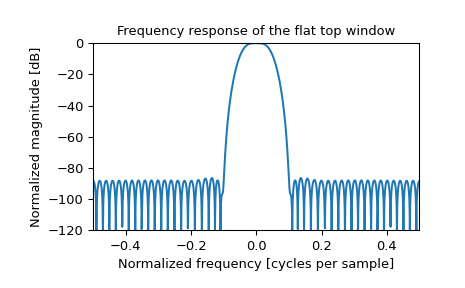
Plot the window and its frequency response:
>>> import numpy as np
>>> from scipy import signal
>>> from scipy.fft import fft, fftshift
>>> import matplotlib.pyplot as plt
>>> window = signal.windows.flattop(51)
>>> plt.plot(window)
>>> plt.title("Flat top window")
>>> plt.ylabel("Amplitude")
>>> plt.xlabel("Sample")
>>> plt.figure()
>>> A = fft(window, 2048) / (len(window)/2.0)
>>> freq = np.linspace(-0.5, 0.5, len(A))
>>> response = 20 * np.log10(np.abs(fftshift(A / abs(A).max())))
>>> plt.plot(freq, response)
>>> plt.axis([-0.5, 0.5, -120, 0])
>>> plt.title("Frequency response of the flat top window")
>>> plt.ylabel("Normalized magnitude [dB]")
>>> plt.xlabel("Normalized frequency [cycles per sample]")