exponential#
- scipy.signal.windows.exponential(M, center=None, tau=1.0, sym=True, *, xp=None, device=None)[source]#
Return an exponential (or Poisson) window.
- Parameters:
- Mint
Number of points in the output window. If zero, an empty array is returned. An exception is thrown when it is negative.
- centerfloat, optional
Parameter defining the center location of the window function. The default value if not given is
center = (M-1) / 2. This parameter must take its default value for symmetric windows.- taufloat, optional
Parameter defining the decay. For
center = 0usetau = -(M-1) / ln(x)ifxis the fraction of the window remaining at the end.- symbool, optional
When True (default), generates a symmetric window, for use in filter design. When False, generates a periodic window, for use in spectral analysis.
- xparray_namespace, optional
Optional array namespace. Should be compatible with the array API standard, or supported by array-api-compat. Default:
numpy- deviceany
optional device specification for output. Should match one of the supported device specification in
xp.
- Returns:
- wndarray
The window, with the maximum value normalized to 1 (though the value 1 does not appear if M is even and sym is True).
Notes
The Exponential window is defined as
\[w(n) = e^{-|n-center| / \tau}\]Array API Standard Support
exponentialhas support for Python Array API Standard compatible backends in addition to NumPy. The following combinations of backend and device (or other capability) are supported.Library
CPU
GPU
NumPy
✅
n/a
CuPy
n/a
✅
PyTorch
✅
✅
JAX
✅
✅
Dask
✅
n/a
See Support for the array API standard for more information.
References
[1]S. Gade and H. Herlufsen, “Windows to FFT analysis (Part I)”, Technical Review 3, Bruel & Kjaer, 1987.
Examples
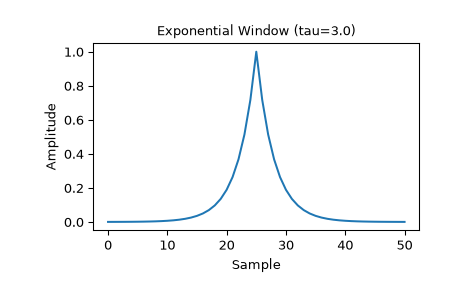
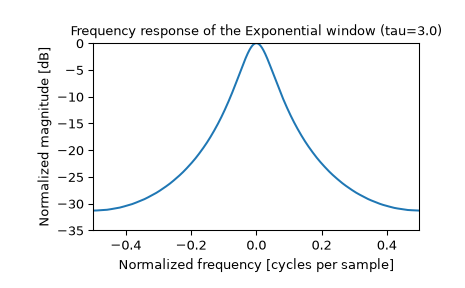
Plot the symmetric window and its frequency response:
>>> import numpy as np
>>> from scipy import signal
>>> from scipy.fft import fft, fftshift
>>> import matplotlib.pyplot as plt
>>> M = 51
>>> tau = 3.0
>>> window = signal.windows.exponential(M, tau=tau)
>>> plt.plot(window)
>>> plt.title("Exponential Window (tau=3.0)")
>>> plt.ylabel("Amplitude")
>>> plt.xlabel("Sample")
>>> plt.figure()
>>> A = fft(window, 2048) / (len(window)/2.0)
>>> freq = np.linspace(-0.5, 0.5, len(A))
>>> response = 20 * np.log10(np.abs(fftshift(A / abs(A).max())))
>>> plt.plot(freq, response)
>>> plt.axis([-0.5, 0.5, -35, 0])
>>> plt.title("Frequency response of the Exponential window (tau=3.0)")
>>> plt.ylabel("Normalized magnitude [dB]")
>>> plt.xlabel("Normalized frequency [cycles per sample]")
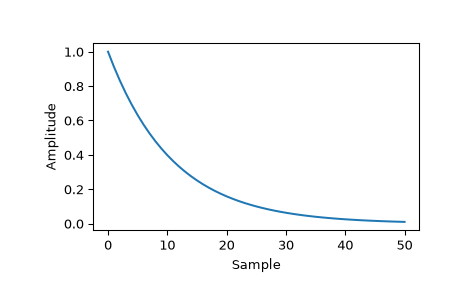
This function can also generate non-symmetric windows:
>>> tau2 = -(M-1) / np.log(0.01)
>>> window2 = signal.windows.exponential(M, 0, tau2, False)
>>> plt.figure()
>>> plt.plot(window2)
>>> plt.ylabel("Amplitude")
>>> plt.xlabel("Sample")