scipy.special.bdtr#
- scipy.special.bdtr(k, n, p, out=None) = <ufunc 'bdtr'>#
Binomial distribution cumulative distribution function.
Sum of the terms 0 through floor(k) of the Binomial probability density.
\[\mathrm{bdtr}(k, n, p) = \sum_{j=0}^{\lfloor k \rfloor} {{n}\choose{j}} p^j (1-p)^{n-j}\]- Parameters:
- karray_like
Number of successes (double), rounded down to the nearest integer.
- narray_like
Number of events (int).
- parray_like
Probability of success in a single event (float).
- outndarray, optional
Optional output array for the function values
- Returns:
- yscalar or ndarray
Probability of floor(k) or fewer successes in n independent events with success probabilities of p.
Notes
The terms are not summed directly; instead the regularized incomplete beta function is employed, according to the formula,
\[\mathrm{bdtr}(k, n, p) = I_{1 - p}(n - \lfloor k \rfloor, \lfloor k \rfloor + 1).\]Wrapper for the Cephes [1] routine
bdtr.Array API Standard Support
bdtrhas support for Python Array API Standard compatible backends in addition to NumPy. The following combinations of backend and device (or other capability) are supported.Library
CPU
GPU
NumPy
✅
n/a
CuPy
n/a
✅
PyTorch
✅
⛔
JAX
✅
⛔
Dask
✅
n/a
For the NumPy backend, this function supports all NumPy ufunc keyword arguments. Other backends may support
out, but typically none of the other ufunc kwargs.outis typically supported for CuPy and PyTorch, but not currently in cases where SciPy relies on a generic Array API implementation or, for PyTorch on CPU, falls back to the NumPy backend.outis never supported for JAX because JAX arrays are immutable.bdtrdoes not currently supportoutfor the PyTorch backend.See Support for the array API standard for more information.
References
[1]Cephes Mathematical Functions Library, https://netlib.org/cephes/
Examples
We have a coin for which the probability of showing heads when flipped is 0.525. The coin is flipped 16 times. What is the probability that the number of heads is less than or equal to 5?
Let X be the number of heads. We want to find the probability that X <= k, given k is 5, the total number of flips n is 16 and the probability p of heads for a single flip is 0.525. This is what
bdtr(k, n, p)computes:>>> from scipy.special import bdtr
>>> bdtr(5, 16, 0.525)
np.float64(0.07281293895810999)
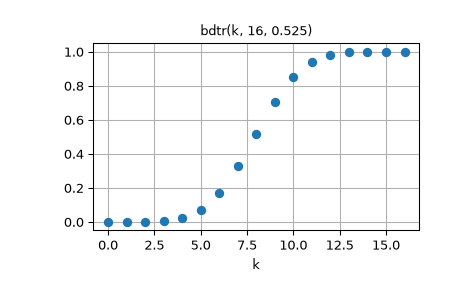
The following plot shows the graph of
bdtr(k, 16, 0.525):>>> import numpy as np >>> import matplotlib.pyplot as plt
>>> n = 16
>>> p = 0.525
>>> k = np.arange(n + 1)
>>> plt.plot(k, bdtr(k, n, p), 'o')
>>> plt.grid(True)
>>> plt.xlabel('k')
>>> plt.title(f"bdtr(k, {n}, {p})")
>>> plt.show()