truncate#
- scipy.stats.truncate(X, lb=-inf, ub=inf)[source]#
Truncate the support of a random variable.
Given a random variable X,
truncatereturns a random variable with support truncated to the interval between lb and ub. The underlying probability density function is normalized accordingly.- Parameters:
- XContinuousDistribution
The random variable to be truncated.
- lb, ubfloat array-like
The lower and upper truncation points, respectively. Must be broadcastable with one another and the shape of X.
- Returns:
- XContinuousDistribution
The truncated random variable.
References
[1]“Truncated Distribution”. Wikipedia. https://en.wikipedia.org/wiki/Truncated_distribution
Examples
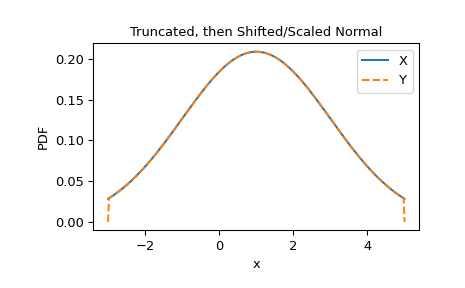
Compare against
scipy.stats.truncnorm, which truncates a standard normal, then shifts and scales it.>>> import numpy as np >>> import matplotlib.pyplot as plt >>> from scipy import stats >>> loc, scale, lb, ub = 1, 2, -2, 2 >>> X = stats.truncnorm(lb, ub, loc, scale) >>> Y = scale * stats.truncate(stats.Normal(), lb, ub) + loc >>> x = np.linspace(-3, 5, 300) >>> plt.plot(x, X.pdf(x), '-', label='X') >>> plt.plot(x, Y.pdf(x), '--', label='Y') >>> plt.xlabel('x') >>> plt.ylabel('PDF') >>> plt.title('Truncated, then Shifted/Scaled Normal') >>> plt.legend() >>> plt.show()
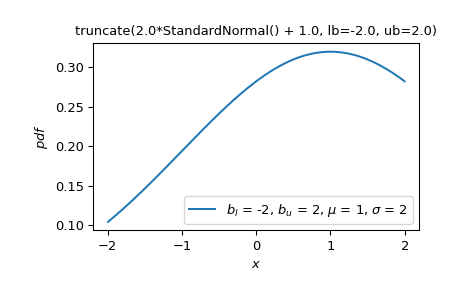
However, suppose we wish to shift and scale a normal random variable, then truncate its support to given values. This is straightforward with
truncate.>>> Z = stats.truncate(scale * stats.Normal() + loc, lb, ub) >>> Z.plot() >>> plt.show()
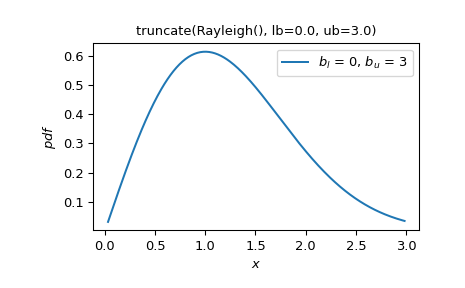
Furthermore,
truncatecan be applied to any random variable:>>> Rayleigh = stats.make_distribution(stats.rayleigh) >>> W = stats.truncate(Rayleigh(), lb=0.5, ub=3) >>> W.plot() >>> plt.show()