scipy.special.k1e#
- scipy.special.k1e(x, out=None) = <ufunc 'k1e'>#
Exponentially scaled modified Bessel function K of order 1.
Defined as:
k1e(x) = exp(x) * k1(x)
- Parameters:
- xarray_like
Argument (float)
- outndarray, optional
Optional output array for the function values
- Returns:
- Kscalar or ndarray
Value of the exponentially scaled modified Bessel function K of order 1 at x.
See also
Notes
The range is partitioned into the two intervals [0, 2] and (2, infinity). Chebyshev polynomial expansions are employed in each interval.
This function is a wrapper for the Cephes [1] routine
k1e.Array API Standard Support
k1ehas experimental support for Python Array API Standard compatible backends in addition to NumPy. Please consider testing these features by setting an environment variableSCIPY_ARRAY_API=1and providing CuPy, PyTorch, JAX, or Dask arrays as array arguments. The following combinations of backend and device (or other capability) are supported.Library
CPU
GPU
NumPy
✅
n/a
CuPy
n/a
✅
PyTorch
✅
✅
JAX
✅
⛔
Dask
✅
n/a
See Support for the array API standard for more information.
References
[1]Cephes Mathematical Functions Library, http://www.netlib.org/cephes/
Examples
In the following example
k1returns 0 whereask1estill returns a useful floating point number.>>> from scipy.special import k1, k1e >>> k1(1000.), k1e(1000.) (0., 0.03964813081296021)
Calculate the function at several points by providing a NumPy array or list for x:
>>> import numpy as np
>>> k1e(np.array([0.5, 2., 3.]))
array([2.73100971, 1.03347685, 0.80656348])
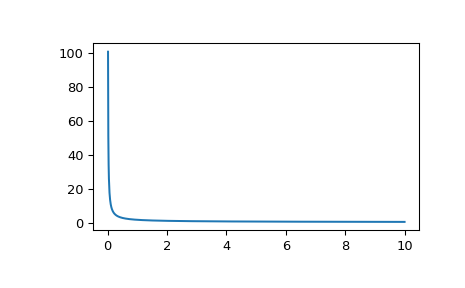
Plot the function from 0 to 10.
>>> import matplotlib.pyplot as plt
>>> fig, ax = plt.subplots()
>>> x = np.linspace(0., 10., 1000)
>>> y = k1e(x)
>>> ax.plot(x, y)
>>> plt.show()