scipy.special.eval_hermitenorm#
- scipy.special.eval_hermitenorm(n, x, out=None) = <ufunc 'eval_hermitenorm'>#
Evaluate probabilist’s (normalized) Hermite polynomial at a point.
Defined by
\[He_n(x) = (-1)^n e^{x^2/2} \frac{d^n}{dx^n} e^{-x^2/2};\]\(He_n\) is a polynomial of degree \(n\). See 22.11.8 in [AS] or [DLMF] for details.
- Parameters:
- narray_like
Degree of the polynomial
- xarray_like
Points at which to evaluate the Hermite polynomial
- outndarray, optional
Optional output array for the function values
- Returns:
- Hescalar or ndarray
Values of the Hermite polynomial
See also
roots_hermitenormroots and quadrature weights of probabilist’s Hermite polynomials
hermitenormprobabilist’s Hermite polynomial object
numpy.polynomial.hermite_e.HermiteEProbabilist’s Hermite series
eval_hermiteevaluate physicist’s Hermite polynomials
References
[AS]Milton Abramowitz and Irene A. Stegun, eds. Handbook of Mathematical Functions with Formulas, Graphs, and Mathematical Tables. New York: Dover, 1972.
[DLMF]NIST Digital Library of Mathematical Functions, https://dlmf.nist.gov/18.5.T1
Examples
>>> import numpy as np
>>> from scipy.special import eval_hermitenorm
>>> import matplotlib.pyplot as plt
Evaluate the order 3 polynomial at a few values of x.
>>> eval_hermitenorm(3, [0, 0.25, 0.5])
array([-0.      , -0.734375, -1.375   ])
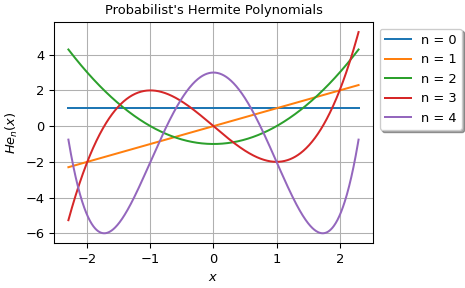
Plot the polynomials of order 0 through 4.
>>> x = np.linspace(-2.3, 2.3, 800)
>>> fig, ax = plt.subplots(1, 1, constrained_layout=True)
>>> for n in range(5):
...     y = eval_hermitenorm(n, x)
...     ax.plot(x, y, label=f'{n = }')
>>> ax.grid()
>>> ax.set_title("Probabilist's Hermite Polynomials")
>>> ax.set_xlabel("$x$")
>>> ax.set_ylabel("$He_n(x)$")
>>> ax.legend(loc='upper left', bbox_to_anchor=(1, 1), shadow=True)
>>> plt.show()