kaiser_bessel_derived#
- scipy.signal.windows.kaiser_bessel_derived(M, beta, *, sym=True, xp=None, device=None)[source]#
Return a Kaiser-Bessel derived window.
- Parameters:
- Mint
Number of points in the output window. If zero, an empty array is returned. An exception is thrown when it is negative. Note that this window is only defined for an even number of points.
- betafloat
Kaiser window shape parameter.
- symbool, optional
This parameter only exists to comply with the interface offered by the other window functions and to be callable by
get_window. When True (default), generates a symmetric window, for use in filter design.- xparray_namespace, optional
Optional array namespace. Should be compatible with the array API standard, or supported by array-api-compat. Default:
numpy- deviceany
optional device specification for output. Should match one of the supported device specification in
xp.
- Returns:
- wndarray
The window, normalized to fulfil the Princen-Bradley condition.
See also
Notes
It is designed to be suitable for use with the modified discrete cosine transform (MDCT) and is mainly used in audio signal processing and audio coding.
Added in version 1.9.0.
Array API Standard Support
kaiser_bessel_derivedhas experimental support for Python Array API Standard compatible backends in addition to NumPy. Please consider testing these features by setting an environment variableSCIPY_ARRAY_API=1and providing CuPy, PyTorch, JAX, or Dask arrays as array arguments. The following combinations of backend and device (or other capability) are supported.Library
CPU
GPU
NumPy
✅
n/a
CuPy
n/a
✅
PyTorch
✅
✅
JAX
✅
✅
Dask
✅
n/a
See Support for the array API standard for more information.
References
[1]Bosi, Marina, and Richard E. Goldberg. Introduction to Digital Audio Coding and Standards. Dordrecht: Kluwer, 2003.
[2]Wikipedia, “Kaiser window”, https://en.wikipedia.org/wiki/Kaiser_window
Examples
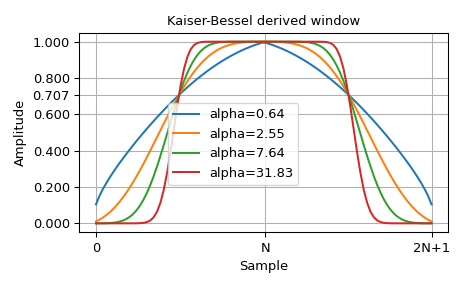
Plot the Kaiser-Bessel derived window based on the wikipedia reference [2]:
>>> import numpy as np
>>> from scipy import signal
>>> import matplotlib.pyplot as plt
>>> fig, ax = plt.subplots()
>>> N = 50
>>> for alpha in [0.64, 2.55, 7.64, 31.83]:
...     ax.plot(signal.windows.kaiser_bessel_derived(2*N, np.pi*alpha),
...             label=f"{alpha=}")
>>> ax.grid(True)
>>> ax.set_title("Kaiser-Bessel derived window")
>>> ax.set_ylabel("Amplitude")
>>> ax.set_xlabel("Sample")
>>> ax.set_xticks([0, N, 2*N-1])
>>> ax.set_xticklabels(["0", "N", "2N+1"])
>>> ax.set_yticks([0.0, 0.2, 0.4, 0.6, 0.707, 0.8, 1.0])
>>> fig.legend(loc="center")
>>> fig.tight_layout()
>>> fig.show()