lp2lp#
- scipy.signal.lp2lp(b, a, wo=1.0)[source]#
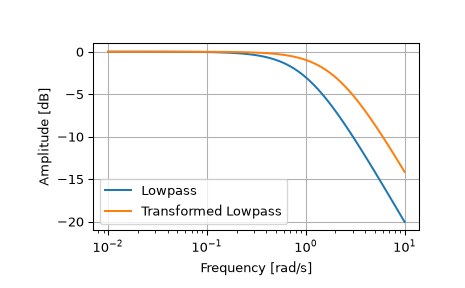
Transform a lowpass filter prototype to a different frequency.
Return an analog low-pass filter with cutoff frequency wo from an analog low-pass filter prototype with unity cutoff frequency, in transfer function (‘ba’) representation.
- Parameters:
- barray_like, shape (M,)
Numerator polynomial coefficients. Must be 1-D.
- aarray_like, shape (N,)
Denominator polynomial coefficients. Must be 1-D.
- wofloat
Desired cutoff, as angular frequency (e.g. rad/s). Defaults to no change.
- Returns:
- barray_like
Numerator polynomial coefficients of the transformed low-pass filter.
- aarray_like
Denominator polynomial coefficients of the transformed low-pass filter.
Notes
This is derived from the s-plane substitution
\[s \rightarrow \frac{s}{\omega_0}\]Array API Standard Support
lp2lphas support for Python Array API Standard compatible backends in addition to NumPy. The following combinations of backend and device (or other capability) are supported.Library
CPU
GPU
NumPy
✅
n/a
CuPy
n/a
✅
PyTorch
✅
✅
JAX
⚠️ no JIT
⛔
Dask
⚠️ computes graph
n/a
See Support for the array API standard for more information.
Examples
>>> from scipy import signal
>>> import matplotlib.pyplot as plt
>>> lp = signal.lti([1.0], [1.0, 1.0])
>>> lp2 = signal.lti(*signal.lp2lp(lp.num, lp.den, 2))
>>> w, mag_lp, p_lp = lp.bode()
>>> w, mag_lp2, p_lp2 = lp2.bode(w)
>>> plt.plot(w, mag_lp, label='Lowpass')
>>> plt.plot(w, mag_lp2, label='Transformed Lowpass')
>>> plt.semilogx()
>>> plt.grid(True)
>>> plt.xlabel('Frequency [rad/s]')
>>> plt.ylabel('Amplitude [dB]')
>>> plt.legend()