cheb2ap#
- scipy.signal.cheb2ap(N, rs, *, xp=None, device=None)[source]#
Return (z,p,k) for Nth-order Chebyshev type II analog lowpass filter.
The returned filter prototype has attenuation of at least
rsdecibels in the stopband.The filter’s angular (e.g. rad/s) cutoff frequency is normalized to 1, defined as the point at which the attenuation first reaches
rs.- Parameters:
- Nint
The order of the filter
- rsfloat
The attenuation in the stopband
- xparray_namespace, optional
Optional array namespace. Should be compatible with the array API standard, or supported by array-api-compat. Default:
numpy- deviceany
optional device specification for output. Should match one of the supported device specification in
xp.
- Returns:
- zndarray[complex128]
Zeros of the transfer function.
- pndarray[complex128]
Poles of the transfer function.
- kfloat
Gain of the transfer function.
See also
cheby2Filter design function using this prototype
Notes
Array API Standard Support
cheb2aphas support for Python Array API Standard compatible backends in addition to NumPy. The following combinations of backend and device (or other capability) are supported.Library
CPU
GPU
NumPy
✅
n/a
CuPy
n/a
✅
PyTorch
✅
✅
JAX
✅
✅
Dask
✅
n/a
See Support for the array API standard for more information.
Examples
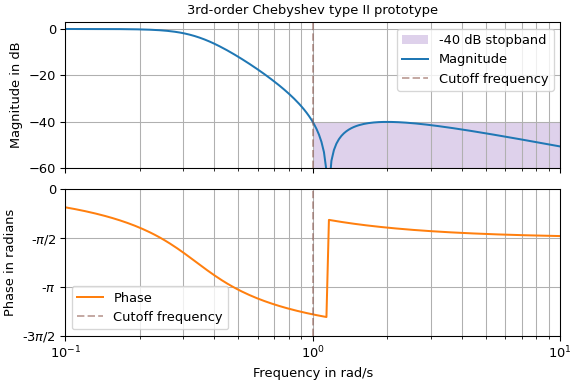
The following plot depicts the frequency response of a 3rd-order prototype with a stopband attenuation of 40 dB:
>>> import numpy as np
>>> import matplotlib.pyplot as plt
>>> from scipy.signal import freqs_zpk, cheb2ap
...
>>> z, p, k = cheb2ap(3, rs=40)
...
>>> f = np.geomspace(1e-1, 1e1, 200)
>>> _, h = freqs_zpk(z, p, k, worN=f)
>>> h_db, h_ph = 20 * np.log10(np.abs(h)), np.unwrap(np.angle(h))
...
>>> _, (ax0, ax1) = plt.subplots(2, 1, sharex='all', constrained_layout=True,
...                              figsize=(6, 4))
>>> ax0.set(title='3rd-order Chebyshev type II prototype', ylim=(-60, 3),
...         ylabel='Magnitude in dB', yticks=[-60, -40, -20, 0])
>>> ax0.fill((1, 1, 10, 10), (-40, -60, -60, -40), 'C4', alpha=.3,
...          label="-40 dB stopband")
>>> ax0.semilogx(f, h_db, 'C0', label='Magnitude')
>>> ax1.set(ylabel="Phase in radians", xlabel="Frequency in rad/s",
...         yticks=np.pi*np.arange(-1.5, 0.5, 0.5), ylim=(-1.5*np.pi, 0),
...         yticklabels=[r'-3$\pi$/2', r'-$\pi$', r'-$\pi$/2', '0'],
...         xlim=(f[0], f[-1]))
>>> ax1.semilogx(f, h_ph, 'C1', label='Phase')
>>> for ax_ in (ax0, ax1):
...     ax_.axvline(1.0, color='C5', ls='--', alpha=.5, label='Cutoff frequency')
...     ax_.grid(True, which='both')
...     ax_.legend()
>>> plt.show()