barycentric_interpolate#
- scipy.interpolate.barycentric_interpolate(xi, yi, x, axis=0, *, der=0, rng=None)[source]#
Convenience function for barycentric interpolation.
Constructs a polynomial that passes through a given set of points, then evaluates the polynomial. For reasons of numerical stability, this function does not compute the coefficients of the polynomial.
This function uses a “barycentric interpolation” method that treats the problem as a special case of rational function interpolation. This algorithm is quite stable, numerically, but even in a world of exact computation, unless the x coordinates are chosen very carefully - Chebyshev zeros (e.g., cos(i*pi/n)) are a good choice - polynomial interpolation itself is a very ill-conditioned process due to the Runge phenomenon.
- Parameters:
- xiarray_like
1-D array of x coordinates of the points the polynomial should pass through
- yiarray_like
The y coordinates of the points the polynomial should pass through.
- xscalar or array_like
Point or points at which to evaluate the interpolant.
- axisint, optional
Axis in the yi array corresponding to the x-coordinate values.
- derint or list or None, optional
How many derivatives to evaluate, or None for all potentially nonzero derivatives (that is, a number equal to the number of points), or a list of derivatives to evaluate. This number includes the function value as the ‘0th’ derivative.
- rng
numpy.random.Generator, optional Pseudorandom number generator state. When rng is None, a new
numpy.random.Generatoris created using entropy from the operating system. Types other thannumpy.random.Generatorare passed tonumpy.random.default_rngto instantiate aGenerator.
- Returns:
- yscalar or array_like
Interpolated values. Shape is determined by replacing the interpolation axis in the original array with the shape of x.
See also
BarycentricInterpolatorBarycentric interpolator
Notes
Construction of the interpolation weights is a relatively slow process. If you want to call this many times with the same xi (but possibly varying yi or x) you should use the class
BarycentricInterpolator. This is what this function uses internally.Examples
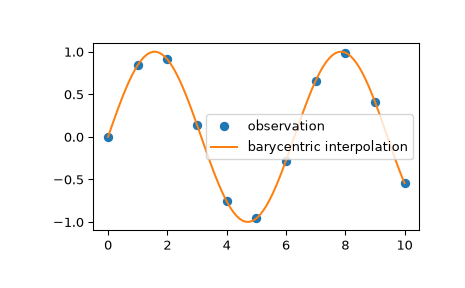
We can interpolate 2D observed data using barycentric interpolation:
>>> import numpy as np
>>> import matplotlib.pyplot as plt
>>> from scipy.interpolate import barycentric_interpolate
>>> x_observed = np.linspace(0.0, 10.0, 11)
>>> y_observed = np.sin(x_observed)
>>> x = np.linspace(min(x_observed), max(x_observed), num=100)
>>> y = barycentric_interpolate(x_observed, y_observed, x)
>>> plt.plot(x_observed, y_observed, "o", label="observation")
>>> plt.plot(x, y, label="barycentric interpolation")
>>> plt.legend()
>>> plt.show()