approximate_taylor_polynomial#
- scipy.interpolate.approximate_taylor_polynomial(f, x, degree, scale, order=None)[source]#
Estimate the Taylor polynomial of f at x by polynomial fitting.
Deprecated since version 1.18.0: This function is deprecated and will be removed in SciPy 1.20.0. Use the following code instead:
import numpy as np

def f(z): return np.exp(z**2)  # example function
N = 10  # number of terms in the Taylor expansion
zz = np.exp(2j * np.pi * np.arange(N) / N)  # roots of unity
c = np.fft.fft(f(zz)) / N
c = np.real(c)  # c must be real by symmetry
- Parameters:
- fcallable
The function whose Taylor polynomial is sought. Should accept a vector of x values.
- xscalar
The point at which the polynomial is to be evaluated.
- degreeint
The degree of the Taylor polynomial
- scalescalar
The width of the interval to use to evaluate the Taylor polynomial. Function values spread over a range this wide are used to fit the polynomial. Must be chosen carefully.
- orderint or None, optional
The order of the polynomial to be used in the fitting; f will be evaluated
order+1times. If None, use degree.
- Returns:
- ppoly1d instance
The Taylor polynomial (translated to the origin, so that for example p(0)=f(x)).
Notes
The appropriate choice of “scale” is a trade-off; too large and the function differs from its Taylor polynomial too much to get a good answer, too small and round-off errors overwhelm the higher-order terms. The algorithm used becomes numerically unstable around order 30 even under ideal circumstances.
Choosing order somewhat larger than degree may improve the higher-order terms.
Array API Standard Support
approximate_taylor_polynomialis not in-scope for support of Python Array API Standard compatible backends other than NumPy.See Support for the array API standard for more information.
Examples
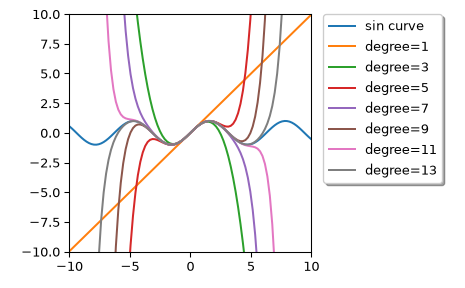
We can calculate Taylor approximation polynomials of sin function with various degrees:
>>> import numpy as np
>>> import matplotlib.pyplot as plt
>>> from scipy.interpolate import approximate_taylor_polynomial
>>> x = np.linspace(-10.0, 10.0, num=100)
>>> plt.plot(x, np.sin(x), label="sin curve")
>>> for degree in np.arange(1, 15, step=2):
...     sin_taylor = approximate_taylor_polynomial(np.sin, 0, degree, 1,
...                                                order=degree + 2)
...     plt.plot(x, sin_taylor(x), label=f"degree={degree}")
>>> plt.legend(bbox_to_anchor=(1.05, 1), loc='upper left',
...            borderaxespad=0.0, shadow=True)
>>> plt.tight_layout()
>>> plt.axis([-10, 10, -10, 10])
>>> plt.show()