NearestNDInterpolator#
- class scipy.interpolate.NearestNDInterpolator(x, y, rescale=False, tree_options=None)[source]#
Nearest-neighbor interpolator in N > 1 dimensions.
- Parameters:
- x(npoints, ndims) 2-D ndarray of floats
Data point coordinates.
- y(npoints, …) N-D ndarray of float or complex
Data values. The length of y along the first axis must be equal to the length of x.
- rescalebool, optional
Rescale points to unit cube before performing interpolation. This is useful if some of the input dimensions have incommensurable units and differ by many orders of magnitude.
Added in version 0.14.0.
- tree_optionsdict, optional
Options passed to the underlying
KDTree.Added in version 0.17.0.
Methods
__call__(*args, **query_options)Evaluate interpolator at given points.
See also
griddataInterpolate unstructured D-D data.
LinearNDInterpolatorPiecewise linear interpolator in N dimensions.
CloughTocher2DInterpolatorPiecewise cubic, C1 smooth, curvature-minimizing interpolator in 2D.
interpnInterpolation on a regular grid or rectilinear grid.
RegularGridInterpolatorInterpolator on a regular or rectilinear grid in arbitrary dimensions (
interpnwraps this class).
Notes
Uses
scipy.spatial.KDTreeNote
For data on a regular grid use
interpninstead.Examples
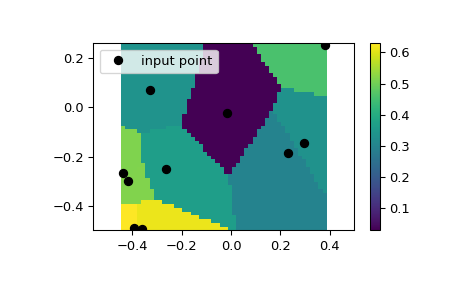
We can interpolate values on a 2D plane:
>>> from scipy.interpolate import NearestNDInterpolator
>>> import numpy as np
>>> import matplotlib.pyplot as plt
>>> rng = np.random.default_rng()
>>> x = rng.random(10) - 0.5
>>> y = rng.random(10) - 0.5
>>> z = np.hypot(x, y)
>>> X = np.linspace(min(x), max(x))
>>> Y = np.linspace(min(y), max(y))
>>> X, Y = np.meshgrid(X, Y)  # 2D grid for interpolation
>>> interp = NearestNDInterpolator(list(zip(x, y)), z)
>>> Z = interp(X, Y)
>>> plt.pcolormesh(X, Y, Z, shading='auto')
>>> plt.plot(x, y, "ok", label="input point")
>>> plt.legend()
>>> plt.colorbar()
>>> plt.axis("equal")
>>> plt.show()