__call__#
- BivariateSpline.__call__(x, y, dx=0, dy=0, grid=True)[source]#
Evaluate the spline or its derivatives at given positions.
- Parameters:
- x, yarray_like
Input coordinates.
If grid is False, evaluate the spline at points
(x[i],
y[i]), i=0, ..., len(x)-1
. Standard Numpy broadcasting is obeyed.If grid is True: evaluate spline at the grid points defined by the coordinate arrays x, y. The arrays must be sorted to increasing order.
The ordering of axes is consistent with
np.meshgrid(..., indexing="ij")and inconsistent with the default orderingnp.meshgrid(..., indexing="xy").- dxint
Order of x-derivative
Added in version 0.14.0.
- dyint
Order of y-derivative
Added in version 0.14.0.
- gridbool
Whether to evaluate the results on a grid spanned by the input arrays, or at points specified by the input arrays.
Added in version 0.14.0.
Examples
Suppose that we want to bilinearly interpolate an exponentially decaying function in 2 dimensions.
>>> import numpy as np
>>> from scipy.interpolate import RectBivariateSpline
We sample the function on a coarse grid. Note that the default indexing=”xy” of meshgrid would result in an unexpected (transposed) result after interpolation.
>>> xarr = np.linspace(-3, 3, 100)
>>> yarr = np.linspace(-3, 3, 100)
>>> xgrid, ygrid = np.meshgrid(xarr, yarr, indexing="ij")
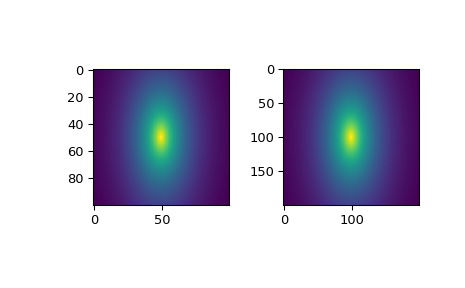
The function to interpolate decays faster along one axis than the other.
>>> zdata = np.exp(-np.sqrt((xgrid / 2) ** 2 + ygrid**2))
Next we sample on a finer grid using interpolation (kx=ky=1 for bilinear).
>>> rbs = RectBivariateSpline(xarr, yarr, zdata, kx=1, ky=1)
>>> xarr_fine = np.linspace(-3, 3, 200)
>>> yarr_fine = np.linspace(-3, 3, 200)
>>> xgrid_fine, ygrid_fine = np.meshgrid(xarr_fine, yarr_fine, indexing="ij")
>>> zdata_interp = rbs(xgrid_fine, ygrid_fine, grid=False)
And check that the result agrees with the input by plotting both.
>>> import matplotlib.pyplot as plt
>>> fig = plt.figure()
>>> ax1 = fig.add_subplot(1, 2, 1, aspect="equal")
>>> ax2 = fig.add_subplot(1, 2, 2, aspect="equal")
>>> ax1.imshow(zdata)
>>> ax2.imshow(zdata_interp)
>>> plt.show()