1 """Create plots of signals generated by chirp() and sweep_poly()."""
2
3 import numpy as np
4 from scipy.signal.waveforms import chirp, sweep_poly
5 from numpy import poly1d
6
7 from pylab import figure, plot, show, xlabel, ylabel, subplot, grid, title, \
8 yscale, savefig, clf
9
10 FIG_SIZE = (7.5, 3.75)
11
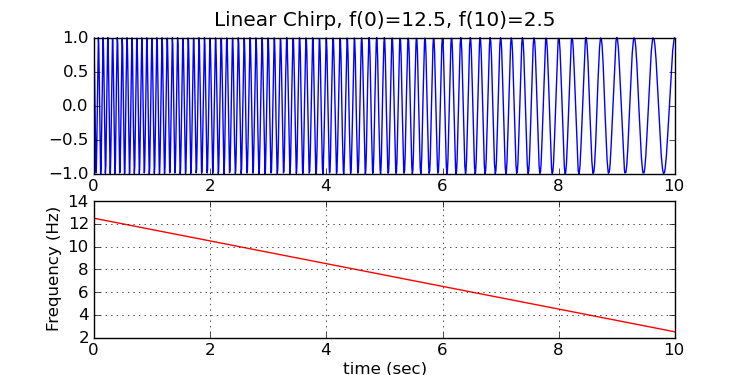
12 def make_linear(f0, t1, f1, filename=None, fig_size=FIG_SIZE):
13 t = np.linspace(0, t1, 5001)
14 w = chirp(t, f0=f0, f1=f1, t1=t1, method='linear')
15
16 figure(1, figsize=fig_size)
17 clf()
18
19 subplot(2,1,1)
20 plot(t, w)
21 tstr = "Linear Chirp, f(0)=%g, f(%g)=%g" % (f0, t1, f1)
22 title(tstr)
23
24 subplot(2,1,2)
25 plot(t, f0 + (f1-f0)*t/t1, 'r')
26 grid(True)
27 ylabel('Frequency (Hz)')
28 xlabel('time (sec)')
29 if filename is None:
30 show()
31 else:
32 savefig(filename)
33
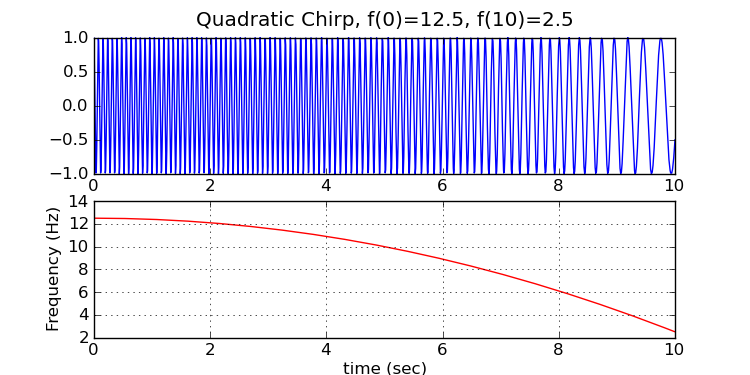
34 def make_quadratic(f0, t1, f1, filename=None, fig_size=FIG_SIZE):
35 t = np.linspace(0, t1, 5001)
36 w = chirp(t, f0=f0, f1=f1, t1=t1, method='quadratic')
37
38 figure(1, figsize=fig_size)
39 clf()
40
41 subplot(2,1,1)
42 plot(t, w)
43 tstr = "Quadratic Chirp, f(0)=%g, f(%g)=%g" % (f0, t1, f1)
44 title(tstr)
45
46 subplot(2,1,2)
47 plot(t, f0 + (f1-f0)*t**2/t1**2, 'r')
48 grid(True)
49 ylabel('Frequency (Hz)')
50 xlabel('time (sec)')
51 if filename is None:
52 show()
53 else:
54 savefig(filename)
55
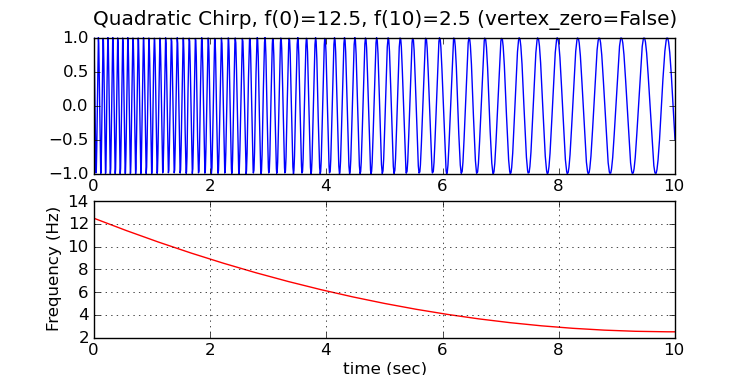
56 def make_quadratic_v0false(f0, t1, f1, filename=None, fig_size=FIG_SIZE):
57 t = np.linspace(0, t1, 5001)
58 w = chirp(t, f0=f0, f1=f1, t1=t1, method='quadratic', vertex_zero=False)
59
60 figure(1, figsize=fig_size)
61 clf()
62
63 subplot(2,1,1)
64 plot(t, w)
65 tstr = "Quadratic Chirp, f(0)=%g, f(%g)=%g (vertex_zero=False)" % (f0, t1, f1)
66 title(tstr)
67
68 subplot(2,1,2)
69 plot(t, f1 - (f1-f0)*(t1-t)**2/t1**2, 'r')
70 grid(True)
71 ylabel('Frequency (Hz)')
72 xlabel('time (sec)')
73 if filename is None:
74 show()
75 else:
76 savefig(filename)
77
78 def make_logarithmic(f0, t1, f1, filename=None, fig_size=FIG_SIZE):
79 t = np.linspace(0, t1, 5001)
80 w = chirp(t, f0=f0, f1=f1, t1=t1, method='logarithmic')
81
82 figure(1, figsize=fig_size)
83 clf()
84
85 subplot(2,1,1)
86 plot(t, w)
87 tstr = "Logarithmic Chirp, f(0)=%g, f(%g)=%g" % (f0, t1, f1)
88 title(tstr)
89
90 subplot(2,1,2)
91 plot(t, f0 * (f1/f0)**(t/t1), 'r')
92
93 grid(True)
94 ylabel('Frequency (Hz)')
95 xlabel('time (sec)')
96 if filename is None:
97 show()
98 else:
99 savefig(filename)
100
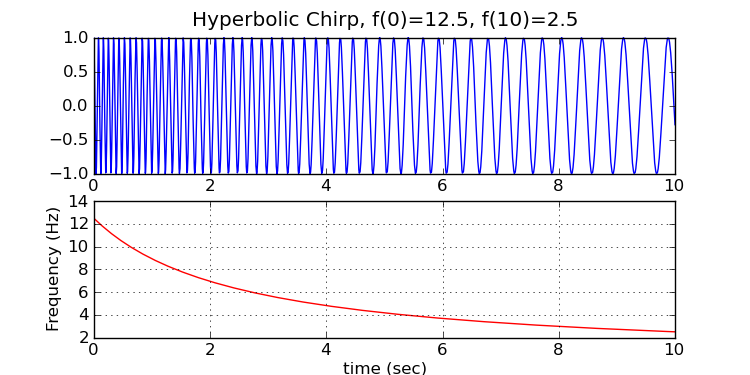
101 def make_hyperbolic(f0, t1, f1, filename=None, fig_size=FIG_SIZE):
102 t = np.linspace(0, t1, 5001)
103 w = chirp(t, f0=f0, f1=f1, t1=t1, method='hyperbolic')
104
105 figure(1, figsize=fig_size)
106 clf()
107
108 subplot(2,1,1)
109 plot(t, w)
110 tstr = "Hyperbolic Chirp, f(0)=%g, f(%g)=%g" % (f0, t1, f1)
111 title(tstr)
112
113 subplot(2,1,2)
114 plot(t, f0 * f1 * t1 / ((f0 - f1)*t + f1*t1), 'r')
115 grid(True)
116 ylabel('Frequency (Hz)')
117 xlabel('time (sec)')
118 if filename is None:
119 show()
120 else:
121 savefig(filename)
122
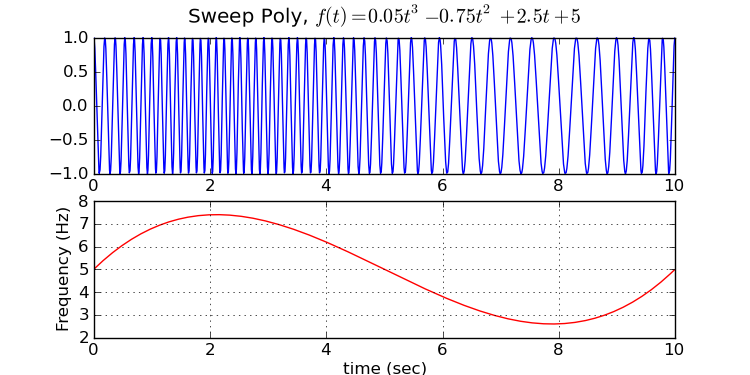
123 def make_sweep_poly(filename=None, fig_size=FIG_SIZE):
124 p = poly1d([0.05, -0.75, 2.5, 5.0])
125
126 t = np.linspace(0, t1, 5001)
127 w = sweep_poly(t, p)
128
129 figure(1, figsize=fig_size)
130 clf()
131
132 subplot(2,1,1)
133 plot(t, w)
134 tstr = "Sweep Poly, $f(t) = 0.05t^3 - 0.75t^2 + 2.5t + 5$"
135 title(tstr)
136
137 subplot(2,1,2)
138 plot(t, p(t), 'r')
139 grid(True)
140 ylabel('Frequency (Hz)')
141 xlabel('time (sec)')
142 if filename is None:
143 show()
144 else:
145 savefig(filename)
146
147
148 if __name__ == "__main__":
149 f0 = 12.5
150 t1 = 10.0
151 f1 = 2.5
152 make_linear(f0, t1, f1, 'chirp_linear.png')
153 make_quadratic(f0, t1, f1, 'chirp_quadratic.png')
154 make_quadratic_v0false(f0, t1, f1, 'chirp_quadratic_v0false.png')
155 make_hyperbolic(f0, t1, f1, 'chirp_hyperbolic.png')
156 make_logarithmic(f0, t1, f1, 'chirp_logarithmic.png')
157
158 make_sweep_poly(filename='sweep_poly.png')