scipy.special.lpmv#
- scipy.special.lpmv(m, v, x, out=None) = <ufunc 'lpmv'>#
Associated Legendre function of integer order and real degree.
Defined as
\[P_v^m(x) = (-1)^m (1 - x^2)^{m/2} \frac{d^m}{dx^m} (P_v(x))\]where
\[P_v(x) = \sum_{k = 0}^\infty \frac{(-v)_k (v + 1)_k}{(k!)^2} \left(\frac{1 - x}{2}\right)^k\]is the Legendre function of the first kind. Here \((\cdot)_k\) is the Pochhammer symbol; see
poch.- Parameters:
- marray_like
Order (int or float). If passed a float not equal to an integer the function returns NaN.
- varray_like
Degree (float).
- xarray_like
Argument (float). Must have
|x| <= 1.- outndarray, optional
Optional output array for the function results.
- Returns:
- pmvscalar or ndarray
Value of the associated Legendre function.
Notes
Note that this implementation includes the Condon-Shortley phase.
Array API Standard Support
lpmvhas experimental support for Python Array API Standard compatible backends in addition to NumPy. Please consider testing these features by setting an environment variableSCIPY_ARRAY_API=1and providing CuPy, PyTorch, JAX, or Dask arrays as array arguments. The following combinations of backend and device (or other capability) are supported.Library
CPU
GPU
NumPy
✅
n/a
CuPy
n/a
✅
PyTorch
✅
⛔
JAX
✅
⛔
Dask
✅
n/a
See Support for the array API standard for more information.
References
[1]Zhang and J.M. Jin, “Computation of Special Functions”, Wiley 1996.
Examples
Compute a single associated Legendre function value:
>>> from scipy.special import lpmv
>>> lpmv(1, 2.5, 0.3)
-0.1292299
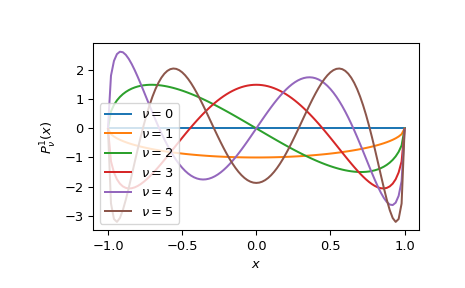
Plot the associated Legendre functions for orders
m = 1andm = 2and degreesv = 0, ..., 5:>>> import numpy as np >>> import matplotlib.pyplot as plt >>> nus = np.arange(0, 6) >>> xs = np.linspace(-1+1e-5, 1-1e-5, 101)
Order 1.
>>> fig, ax = plt.subplots()
>>> ax.plot(xs, lpmv(1, nus, xs[:, np.newaxis]), "-")
>>> ax.legend([rf"$\nu={nu}$" for nu in nus])
>>> ax.set_xlabel(r"$x$")
>>> ax.set_ylabel(r"$P_\nu^1(x)$")
>>> plt.show()
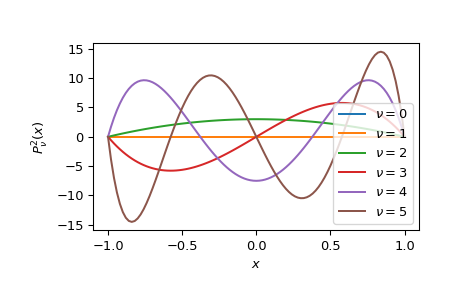
Order 2.
>>> fig, ax = plt.subplots()
>>> ax.plot(xs, lpmv(2, nus, xs[:, np.newaxis]), "-")
>>> ax.legend([rf"$\nu={nu}$" for nu in nus])
>>> ax.set_xlabel(r"$x$")
>>> ax.set_ylabel(r"$P_\nu^2(x)$")
>>> plt.show()