scipy.special.logit#
- scipy.special.logit(x, out=None) = <ufunc 'logit'>#
Logit ufunc for ndarrays.
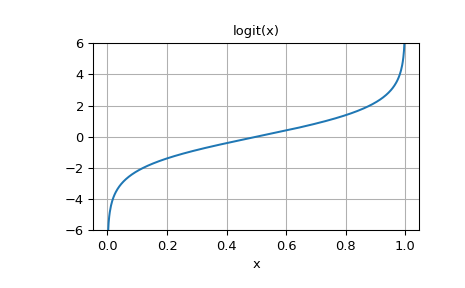
The logit function is defined as logit(p) = log(p/(1-p)). Note that logit(0) = -inf, logit(1) = inf, and logit(p) for p<0 or p>1 yields nan.
- Parameters:
- xndarray
The ndarray to apply logit to element-wise.
- outndarray, optional
Optional output array for the function results
- Returns:
- scalar or ndarray
An ndarray of the same shape as x. Its entries are logit of the corresponding entry of x.
See also
Notes
As a ufunc logit takes a number of optional keyword arguments. For more information see ufuncs
Added in version 0.10.0.
Array API Standard Support
logithas support for Python Array API Standard compatible backends in addition to NumPy. The following combinations of backend and device (or other capability) are supported.Library
CPU
GPU
NumPy
✅
n/a
CuPy
n/a
✅
PyTorch
✅
✅
JAX
✅
✅
Dask
✅
n/a
For the NumPy backend, this function supports all NumPy ufunc keyword arguments. Other backends may support
out, but typically none of the other ufunc kwargs.outis typically supported for CuPy and PyTorch, but not currently in cases where SciPy relies on a generic Array API implementation or, for PyTorch on CPU, falls back to the NumPy backend.outis never supported for JAX because JAX arrays are immutable.See Support for the array API standard for more information.
Examples
>>> import numpy as np
>>> from scipy.special import logit, expit
>>> logit([0, 0.25, 0.5, 0.75, 1])
array([       -inf, -1.09861229,  0.        ,  1.09861229,         inf])
expitis the inverse oflogit:>>> expit(logit([0.1, 0.75, 0.999])) array([ 0.1 , 0.75 , 0.999])
Plot logit(x) for x in [0, 1]:
>>> import matplotlib.pyplot as plt
>>> x = np.linspace(0, 1, 501)
>>> y = logit(x)
>>> plt.plot(x, y)
>>> plt.grid()
>>> plt.ylim(-6, 6)
>>> plt.xlabel('x')
>>> plt.title('logit(x)')
>>> plt.show()