bartlett#
- scipy.signal.windows.bartlett(M, sym=True, *, xp=None, device=None)[source]#
Return a Bartlett window.
The Bartlett window is very similar to a triangular window, except that the end points are at zero. It is often used in signal processing for tapering a signal, without generating too much ripple in the frequency domain.
- Parameters:
- Mint
Number of points in the output window. If zero, an empty array is returned. An exception is thrown when it is negative.
- symbool, optional
When True (default), generates a symmetric window, for use in filter design. When False, generates a periodic window, for use in spectral analysis.
- xparray_namespace, optional
Optional array namespace. Should be compatible with the array API standard, or supported by array-api-compat. Default:
numpy- deviceany
optional device specification for output. Should match one of the supported device specification in
xp.
- Returns:
- wndarray
The triangular window, with the first and last samples equal to zero and the maximum value normalized to 1 (though the value 1 does not appear if M is even and sym is True).
See also
triangA triangular window that does not touch zero at the ends
Notes
The Bartlett window is defined as
\[w(n) = \frac{2}{M-1} \left( \frac{M-1}{2} - \left|n - \frac{M-1}{2}\right| \right)\]Most references to the Bartlett window come from the signal processing literature, where it is used as one of many windowing functions for smoothing values. Note that convolution with this window produces linear interpolation. It is also known as an apodization (which means”removing the foot”, i.e. smoothing discontinuities at the beginning and end of the sampled signal) or tapering function. The Fourier transform of the Bartlett is the product of two sinc functions. Note the excellent discussion in Kanasewich. [2]
Array API Standard Support
bartletthas experimental support for Python Array API Standard compatible backends in addition to NumPy. Please consider testing these features by setting an environment variableSCIPY_ARRAY_API=1and providing CuPy, PyTorch, JAX, or Dask arrays as array arguments. The following combinations of backend and device (or other capability) are supported.Library
CPU
GPU
NumPy
✅
n/a
CuPy
n/a
✅
PyTorch
✅
✅
JAX
✅
✅
Dask
✅
n/a
See Support for the array API standard for more information.
References
[1]M.S. Bartlett, “Periodogram Analysis and Continuous Spectra”, Biometrika 37, 1-16, 1950.
[2]E.R. Kanasewich, “Time Sequence Analysis in Geophysics”, The University of Alberta Press, 1975, pp. 109-110.
[3]A.V. Oppenheim and R.W. Schafer, “Discrete-Time Signal Processing”, Prentice-Hall, 1999, pp. 468-471.
[4]Wikipedia, “Window function”, https://en.wikipedia.org/wiki/Window_function
[5]W.H. Press, B.P. Flannery, S.A. Teukolsky, and W.T. Vetterling, “Numerical Recipes”, Cambridge University Press, 1986, page 429.
Examples
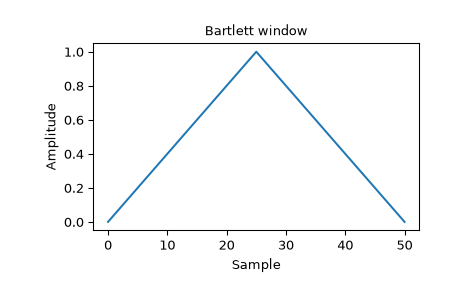
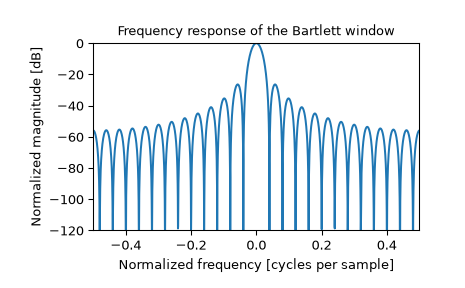
Plot the window and its frequency response:
>>> import numpy as np
>>> from scipy import signal
>>> from scipy.fft import fft, fftshift
>>> import matplotlib.pyplot as plt
>>> window = signal.windows.bartlett(51)
>>> plt.plot(window)
>>> plt.title("Bartlett window")
>>> plt.ylabel("Amplitude")
>>> plt.xlabel("Sample")
>>> plt.figure()
>>> A = fft(window, 2048) / (len(window)/2.0)
>>> freq = np.linspace(-0.5, 0.5, len(A))
>>> response = 20 * np.log10(np.abs(fftshift(A / abs(A).max())))
>>> plt.plot(freq, response)
>>> plt.axis([-0.5, 0.5, -120, 0])
>>> plt.title("Frequency response of the Bartlett window")
>>> plt.ylabel("Normalized magnitude [dB]")
>>> plt.xlabel("Normalized frequency [cycles per sample]")