vectorstrength#
- scipy.signal.vectorstrength(events, period)[source]#
Determine the vector strength of the events corresponding to the given period.
The vector strength is a measure of phase synchrony, how well the timing of the events is synchronized to a single period of a periodic signal.
If multiple periods are used, calculate the vector strength of each. This is called the “resonating vector strength”.
- Parameters:
- events1D array_like
An array of time points containing the timing of the events.
- periodfloat or array_like
The period of the signal that the events should synchronize to. The period is in the same units as events. It can also be an array of periods, in which case the outputs are arrays of the same length.
- Returns:
- strengthfloat or 1D array
The strength of the synchronization. 1.0 is perfect synchronization and 0.0 is no synchronization. If period is an array, this is also an array with each element containing the vector strength at the corresponding period.
- phasefloat or array
The phase that the events are most strongly synchronized to in radians. If period is an array, this is also an array with each element containing the phase for the corresponding period.
Notes
Array API Standard Support
vectorstrengthhas support for Python Array API Standard compatible backends in addition to NumPy. The following combinations of backend and device (or other capability) are supported.Library
CPU
GPU
NumPy
✅
n/a
CuPy
n/a
✅
PyTorch
✅
✅
JAX
⚠️ no JIT
⛔
Dask
⚠️ computes graph
n/a
See Support for the array API standard for more information.
References
[1]Van Hemmen, JL, Longtin, A, and Vollmayr, AN. “Testing resonating vector strength: Auditory system, electric fish, and noise.” Chaos 21, 047508 (2011), DOI:10.1063/1.3670512.
[2]Van Hemmen, JL. “Vector strength after Goldberg, Brown, and von Mises: biological and mathematical perspectives.” Biol Cybern. 2013 Aug; 107(4): 385-96. DOI:10.1007/s00422-013-0561-7.
[3]Van Hemmen, JL and Vollmayr, AN. “Resonating vector strength: what happens when we vary the ‘probing’ frequency while keeping the spike times fixed.” Biol Cybern. 2013 Aug; 107(4): 491-94. DOI:10.1007/s00422-013-0560-8.
Examples
In this example, five events occur exactly 1 second apart, starting at 0.25 s. The vector strength is 1 for
period=1because all events fall at the same phase of every cycle, and the returned phase is π/2, a quarter of the way through the period.>>> import numpy as np >>> from scipy.signal import vectorstrength ... >>> events = np.array([0.25, 1.25, 2.25, 3.25, 4.25]) >>> vectorstrength(events, period=1.0) (np.float64(1.0), np.float64(1.5707963267948968)) # may vary
periodcan also be an array of candidate periods. With the same events as above, the strength stays at 1 at the true period of 1 s and at the sub-multiple period 0.5 s (a form of aliasing), and drops to 0 atperiod=5where the events span a single period at evenly-spaced phases:>>> periods = [1, 5, 0.5] >>> strengths, phases = vectorstrength(events, periods) ... >>> for p_, s_, ph_ in zip(periods, strengths, phases): ... print(f"period = {p_:.1f}: strength = {s_:.2f}, " ... f"phase = {np.rad2deg(ph_):.1f} deg") period = 1.0: strength = 1.00, phase = 90.0 deg period = 5.0: strength = 0.00, phase = 153.4 deg period = 0.5: strength = 1.00, phase = -180.0 deg
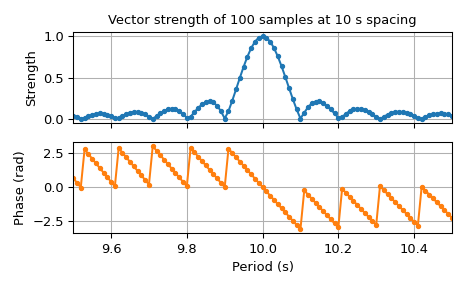
The following example depicts the vector strength and its phase for 100 samples with a constant period of 10 s. The maximum strength of 1 occurs at 10 s with phase 0 rad. Due to the finite number of samples, the strength does not drop to zero away from 10 s but exhibits secondary maxima similar to those of an FFT sidelobe pattern. The phase decreases roughly linearly with jumps of π rad at each sidelobe minimum, consistent with an underlying sinc-like function.
>>> import matplotlib.pyplot as plt
>>> import numpy as np
>>> from scipy.signal import vectorstrength
...
>>> N, T = 100, 10  # samples and sampling interval in seconds
>>> events = np.arange(N) * T
>>> periods = np.linspace(9.5, 10.5, 101)
>>> strength, phase = vectorstrength(events, periods)
...
>>> fig, (ax_strength, ax_phase) = plt.subplots(
...     2, 1, sharex=True, tight_layout=True)
>>> ax_strength.set_title(
...     f"Vector strength of {N} samples at {T} s spacing")
>>> ax_strength.set(ylabel="Strength", xlim=(periods[0], periods[-1]))
>>> ax_strength.grid(True)
>>> ax_phase.set(xlabel="Period (s)", ylabel="Phase (rad)")
>>> ax_phase.grid(True)
>>> ax_strength.plot(periods, strength, 'C0.-')
>>> ax_phase.plot(periods, phase, 'C1.-')
>>> plt.show()