Attachment 'mat3d_ex2.py'
Download 1 #!/usr/bin/env python
2 """Simple example for showing mat3d.plot3 functionality
3 Variables that can be set in mat3d.plot3 :
4 colors = Colors - Sets the colormap
5 linewidth = 0.1 - Sets the width of the plotlines
6 precision=3 - Sets the number of digits accuracy for the text on the axis
7 num_ticks=5 - Number of ticks on axes, evenly spaced """
8
9 import numpy as N
10 import mat3d as M
11
12 x0,x1,npts_x = -1.0,1.1,11
13 y0,y1,npts_y = -1.0,1.1,11
14
15 X,Y = N.mgrid[x0:x1:0.1,y0:y1:0.1]
16 Z = X * N.exp(-X**2 - Y**2)
17
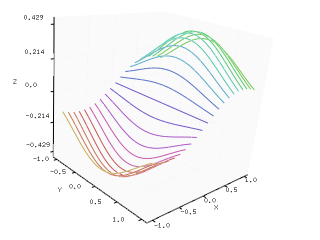
18 M.plot3(X,Y,Z,linewidth =2.0)
New Attachment
Attached Files
To refer to attachments on a page, use attachment:filename, as shown below in the list of files. Do NOT use the URL of the [get] link, since this is subject to change and can break easily.- [get | view] (2006-10-05 15:26:19, 28.1 KB) [[attachment:Lines.png]]
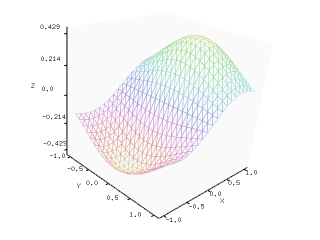
- [get | view] (2006-10-05 15:26:09, 36.5 KB) [[attachment:Mesh.png]]
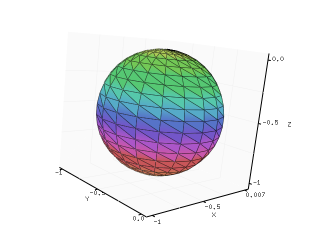
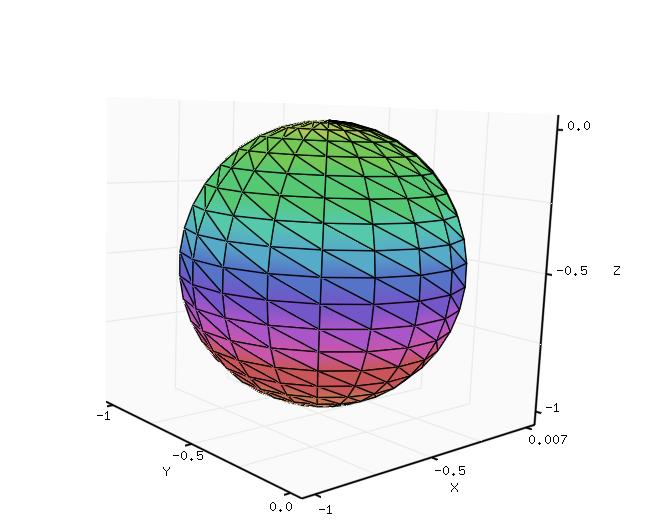
- [get | view] (2006-10-05 15:25:55, 31.8 KB) [[attachment:Sphere1.png]]
- [get | view] (2006-10-12 11:38:56, 41.6 KB) [[attachment:mat3d.py]]
- [get | view] (2006-10-30 13:51:24, 6.8 KB) [[attachment:mat3d.tar.gz]]
- [get | view] (2006-10-30 13:51:06, 9.0 KB) [[attachment:mat3d.zip]]
- [get | view] (2006-09-28 14:46:51, 0.5 KB) [[attachment:mat3d_ex1.py]]
- [get | view] (2006-09-28 14:46:57, 0.6 KB) [[attachment:mat3d_ex2.py]]
- [get | view] (2006-09-28 14:47:03, 0.7 KB) [[attachment:mat3d_ex3.py]]
- [get | view] (2007-01-21 09:50:26, 109.2 KB) [[attachment:mat3d_ex4]]
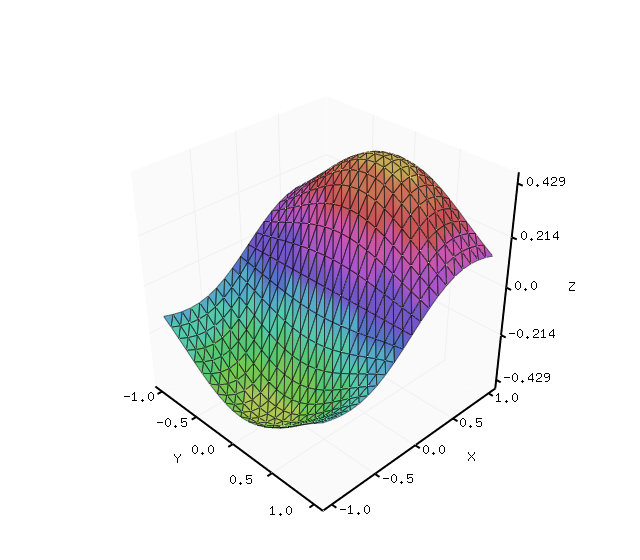
- [get | view] (2007-01-21 09:55:15, 109.2 KB) [[attachment:mat3d_ex4.png]]
- [get | view] (2006-09-28 14:47:10, 1.1 KB) [[attachment:mat3d_ex4.py]]
- [get | view] (2006-09-28 14:47:22, 0.8 KB) [[attachment:mat3d_ex5.py]]
- [get | view] (2006-09-28 14:47:30, 0.5 KB) [[attachment:mat3d_ex6.py]]
- [get | view] (2006-10-12 11:38:30, 815.7 KB) [[attachment:screenshot.gif]]
- [get | view] (2006-09-28 14:47:50, 105.2 KB) [[attachment:screenshot.png]]