relfreq#
- scipy.stats.relfreq(a, numbins=10, defaultreallimits=None, weights=None)[source]#
Return a relative frequency histogram, using the histogram function.
A relative frequency histogram is a mapping of the number of observations in each of the bins relative to the total of observations.
- Parameters:
- aarray_like
Input array.
- numbinsint, optional
The number of bins to use for the histogram. Default is 10.
- defaultreallimitstuple (lower, upper), optional
The lower and upper values for the range of the histogram. If no value is given, a range slightly larger than the range of the values in a is used. Specifically
(a.min() - s, a.max() + s), wheres = (1/2)(a.max() - a.min()) / (numbins - 1).- weightsarray_like, optional
The weights for each value in a. Default is None, which gives each value a weight of 1.0
- Returns:
- frequencyndarray
Binned values of relative frequency.
- lowerlimitfloat
Lower real limit.
- binsizefloat
Width of each bin.
- extrapointsint
Extra points.
Notes
Array API Standard Support
relfreqhas experimental support for Python Array API Standard compatible backends in addition to NumPy. Please consider testing these features by setting an environment variableSCIPY_ARRAY_API=1and providing CuPy, PyTorch, JAX, or Dask arrays as array arguments. The following combinations of backend and device (or other capability) are supported.Library
CPU
GPU
NumPy
✅
n/a
CuPy
n/a
⛔
PyTorch
⛔
⛔
JAX
⛔
⛔
Dask
⛔
n/a
See Support for the array API standard for more information.
Examples
>>> import numpy as np
>>> import matplotlib.pyplot as plt
>>> from scipy import stats
>>> rng = np.random.default_rng()
>>> a = np.array([2, 4, 1, 2, 3, 2])
>>> res = stats.relfreq(a, numbins=4)
>>> res.frequency
array([ 0.16666667, 0.5       , 0.16666667,  0.16666667])
>>> np.sum(res.frequency)  # relative frequencies should add up to 1
1.0
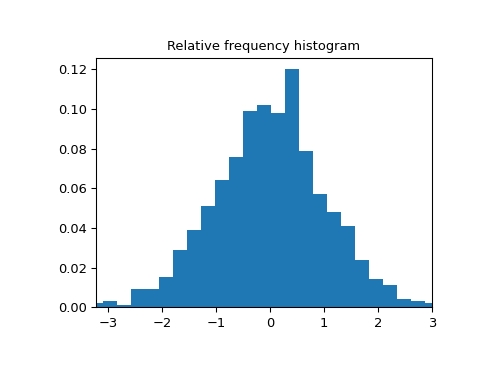
Create a normal distribution with 1000 random values
>>> samples = stats.norm.rvs(size=1000, random_state=rng)
Calculate relative frequencies
>>> res = stats.relfreq(samples, numbins=25)
Calculate space of values for x
>>> x = res.lowerlimit + np.linspace(0, res.binsize*res.frequency.size,
...                                  res.frequency.size)
Plot relative frequency histogram
>>> fig = plt.figure(figsize=(5, 4))
>>> ax = fig.add_subplot(1, 1, 1)
>>> ax.bar(x, res.frequency, width=res.binsize)
>>> ax.set_title('Relative frequency histogram')
>>> ax.set_xlim([x.min(), x.max()])
>>> plt.show()