scipy.special.struve#
- scipy.special.struve(v, x, out=None) = <ufunc 'struve'>#
Struve function.
Return the value of the Struve function of order v at x. The Struve function is defined as,
\[H_v(x) = (z/2)^{v + 1} \sum_{n=0}^\infty \frac{(-1)^n (z/2)^{2n}}{\Gamma(n + \frac{3}{2}) \Gamma(n + v + \frac{3}{2})},\]where \(\Gamma\) is the gamma function.
- Parameters:
- varray_like
Order of the Struve function (float).
- xarray_like
Argument of the Struve function (float; must be positive unless v is an integer).
- outndarray, optional
Optional output array for the function results
- Returns:
- Hscalar or ndarray
Value of the Struve function of order v at x.
See also
modstruveModified Struve function
Notes
Three methods discussed in [1] are used to evaluate the Struve function:
power series
expansion in Bessel functions (if \(|z| < |v| + 20\))
asymptotic large-z expansion (if \(z \geq 0.7v + 12\))
Rounding errors are estimated based on the largest terms in the sums, and the result associated with the smallest error is returned.
References
[1]NIST Digital Library of Mathematical Functions https://dlmf.nist.gov/11
Examples
Calculate the Struve function of order 1 at 2.
>>> import numpy as np
>>> from scipy.special import struve
>>> import matplotlib.pyplot as plt
>>> struve(1, 2.)
0.6467637282835622
Calculate the Struve function at 2 for orders 1, 2 and 3 by providing a list for the order parameter v.
>>> struve([1, 2, 3], 2.)
array([0.64676373, 0.28031806, 0.08363767])
Calculate the Struve function of order 1 for several points by providing an array for x.
>>> points = np.array([2., 5., 8.])
>>> struve(1, points)
array([0.64676373, 0.80781195, 0.48811605])
Compute the Struve function for several orders at several points by providing arrays for v and z. The arrays have to be broadcastable to the correct shapes.
>>> orders = np.array([[1], [2], [3]])
>>> points.shape, orders.shape
((3,), (3, 1))
>>> struve(orders, points)
array([[0.64676373, 0.80781195, 0.48811605],
       [0.28031806, 1.56937455, 1.51769363],
       [0.08363767, 1.50872065, 2.98697513]])
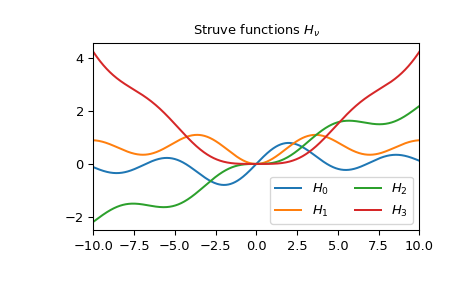
Plot the Struve functions of order 0 to 3 from -10 to 10.
>>> fig, ax = plt.subplots()
>>> x = np.linspace(-10., 10., 1000)
>>> for i in range(4):
...     ax.plot(x, struve(i, x), label=f'$H_{i!r}$')
>>> ax.legend(ncol=2)
>>> ax.set_xlim(-10, 10)
>>> ax.set_title(r"Struve functions $H_{\nu}$")
>>> plt.show()