scipy.special.spence#
- scipy.special.spence(z, out=None) = <ufunc 'spence'>#
Spence’s function, also known as the dilogarithm.
It is defined to be
\[\int_1^z \frac{\log(t)}{1 - t}dt\]for complex \(z\), where the contour of integration is taken to avoid the branch cut of the logarithm. Spence’s function is analytic everywhere except the negative real axis where it has a branch cut.
- Parameters:
- zarray_like
Points at which to evaluate Spence’s function
- outndarray, optional
Optional output array for the function results
- Returns:
- sscalar or ndarray
Computed values of Spence’s function
Notes
There is a different convention which defines Spence’s function by the integral
\[-\int_0^z \frac{\log(1 - t)}{t}dt;\]this is our
spence(1 - z).Array API Standard Support
spencehas experimental support for Python Array API Standard compatible backends in addition to NumPy. Please consider testing these features by setting an environment variableSCIPY_ARRAY_API=1and providing CuPy, PyTorch, JAX, or Dask arrays as array arguments. The following combinations of backend and device (or other capability) are supported.Library
CPU
GPU
NumPy
✅
n/a
CuPy
n/a
⛔
PyTorch
✅
⛔
JAX
✅
✅
Dask
✅
n/a
See Support for the array API standard for more information.
Examples
>>> import numpy as np
>>> from scipy.special import spence
>>> import matplotlib.pyplot as plt
The function is defined for complex inputs:
>>> spence([1-1j, 1.5+2j, 3j, -10-5j])
array([-0.20561676+0.91596559j, -0.86766909-1.39560134j,
       -0.59422064-2.49129918j, -1.14044398+6.80075924j])
For complex inputs on the branch cut, which is the negative real axis, the function returns the limit for
zwith positive imaginary part. For example, in the following, note the sign change of the imaginary part of the output forz = -2andz = -2 - 1e-8j:>>> spence([-2 + 1e-8j, -2, -2 - 1e-8j]) array([2.32018041-3.45139229j, 2.32018042-3.4513923j , 2.32018041+3.45139229j])
The function returns
nanfor real inputs on the branch cut:>>> spence(-1.5) nan
Verify some particular values:
spence(0) = pi**2/6,spence(1) = 0andspence(2) = -pi**2/12.>>> spence([0, 1, 2]) array([ 1.64493407, 0. , -0.82246703]) >>> np.pi**2/6, -np.pi**2/12 (1.6449340668482264, -0.8224670334241132)
Verify the identity:
spence(z) + spence(1 - z) = pi**2/6 - log(z)*log(1 - z)
>>> z = 3 + 4j
>>> spence(z) + spence(1 - z)
(-2.6523186143876067+1.8853470951513935j)
>>> np.pi**2/6 - np.log(z)*np.log(1 - z)
(-2.652318614387606+1.885347095151394j)
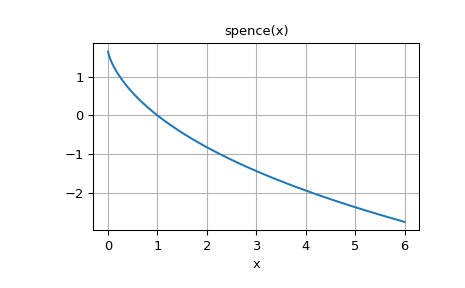
Plot the function for positive real input.
>>> fig, ax = plt.subplots()
>>> x = np.linspace(0, 6, 400)
>>> ax.plot(x, spence(x))
>>> ax.grid()
>>> ax.set_xlabel('x')
>>> ax.set_title('spence(x)')
>>> plt.show()