scipy.spatial.
delaunay_plot_2d#
- scipy.spatial.delaunay_plot_2d(tri, ax=None)[source]#
Plot the given Delaunay triangulation in 2-D
- Parameters:
- triscipy.spatial.Delaunay instance
Triangulation to plot
- axmatplotlib.axes.Axes instance, optional
Axes to plot on
- Returns:
- figmatplotlib.figure.Figure instance
Figure for the plot
See also
Notes
Requires Matplotlib.
Examples
>>> import numpy as np
>>> import matplotlib.pyplot as plt
>>> from scipy.spatial import Delaunay, delaunay_plot_2d
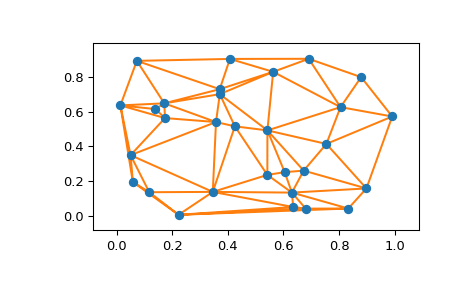
The Delaunay triangulation of a set of random points:
>>> rng = np.random.default_rng()
>>> points = rng.random((30, 2))
>>> tri = Delaunay(points)
Plot it:
>>> _ = delaunay_plot_2d(tri)
>>> plt.show()