prewitt#
- scipy.ndimage.prewitt(input, axis=-1, output=None, mode='reflect', cval=0.0)[source]#
Calculate a Prewitt filter.
- Parameters:
- inputarray_like
The input array.
- axisint, optional
The axis of input along which to calculate. Default is -1.
- outputarray or dtype, optional
The array in which to place the output, or the dtype of the returned array. By default an array of the same dtype as input will be created.
- modestr or sequence, optional
The mode parameter determines how the input array is extended when the filter overlaps a border. By passing a sequence of modes with length equal to the number of dimensions of the input array, different modes can be specified along each axis. Default value is ‘reflect’. The valid values and their behavior is as follows:
- ‘reflect’ (d c b a | a b c d | d c b a)
The input is extended by reflecting about the edge of the last pixel. This mode is also sometimes referred to as half-sample symmetric.
- ‘constant’ (k k k k | a b c d | k k k k)
The input is extended by filling all values beyond the edge with the same constant value, defined by the cval parameter.
- ‘nearest’ (a a a a | a b c d | d d d d)
The input is extended by replicating the last pixel.
- ‘mirror’ (d c b | a b c d | c b a)
The input is extended by reflecting about the center of the last pixel. This mode is also sometimes referred to as whole-sample symmetric.
- ‘wrap’ (a b c d | a b c d | a b c d)
The input is extended by wrapping around to the opposite edge.
For consistency with the interpolation functions, the following mode names can also be used:
- ‘grid-constant’
This is a synonym for ‘constant’.
- ‘grid-mirror’
This is a synonym for ‘reflect’.
- ‘grid-wrap’
This is a synonym for ‘wrap’.
- cvalscalar, optional
Value to fill past edges of input if mode is ‘constant’. Default is 0.0.
- Returns:
- prewittndarray
Filtered array. Has the same shape as input.
See also
sobelSobel filter
Notes
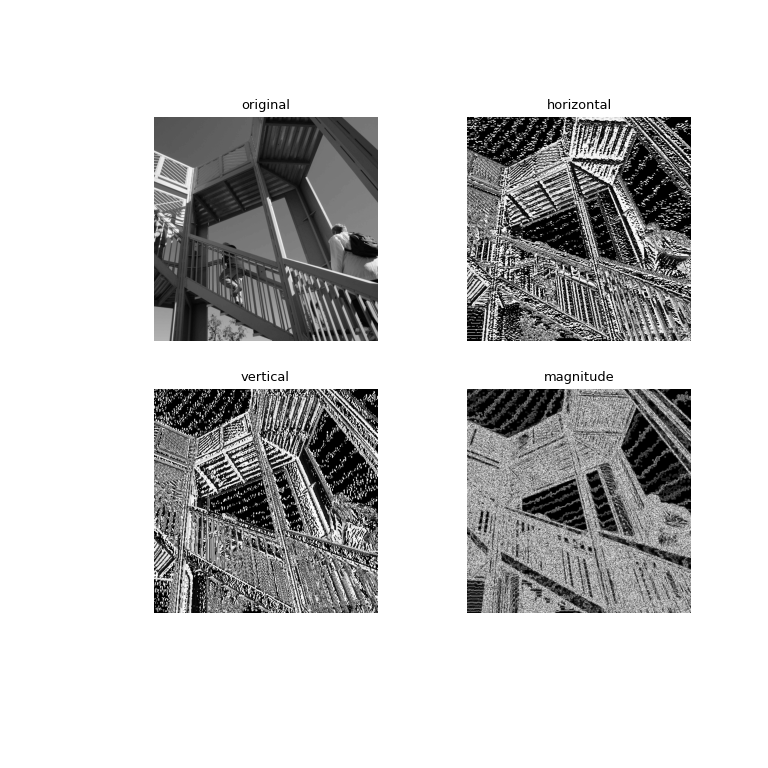
This function computes the one-dimensional Prewitt filter. Horizontal edges are emphasised with the horizontal transform (axis=0), vertical edges with the vertical transform (axis=1), and so on for higher dimensions. These can be combined to give the magnitude.
Examples
>>> from scipy import ndimage, datasets
>>> import matplotlib.pyplot as plt
>>> import numpy as np
>>> ascent = datasets.ascent()
>>> prewitt_h = ndimage.prewitt(ascent, axis=0)
>>> prewitt_v = ndimage.prewitt(ascent, axis=1)
>>> magnitude = np.sqrt(prewitt_h ** 2 + prewitt_v ** 2)
>>> magnitude *= 255 / np.max(magnitude) # Normalization
>>> fig, axes = plt.subplots(2, 2, figsize = (8, 8))
>>> plt.gray()
>>> axes[0, 0].imshow(ascent)
>>> axes[0, 1].imshow(prewitt_h)
>>> axes[1, 0].imshow(prewitt_v)
>>> axes[1, 1].imshow(magnitude)
>>> titles = ["original", "horizontal", "vertical", "magnitude"]
>>> for i, ax in enumerate(axes.ravel()):
...     ax.set_title(titles[i])
...     ax.axis("off")
>>> plt.show()